Showing posts with label Marketing. Show all posts

Tuesday, July 28, 2026

Growth You Cannot Explain Is Not a Strategy

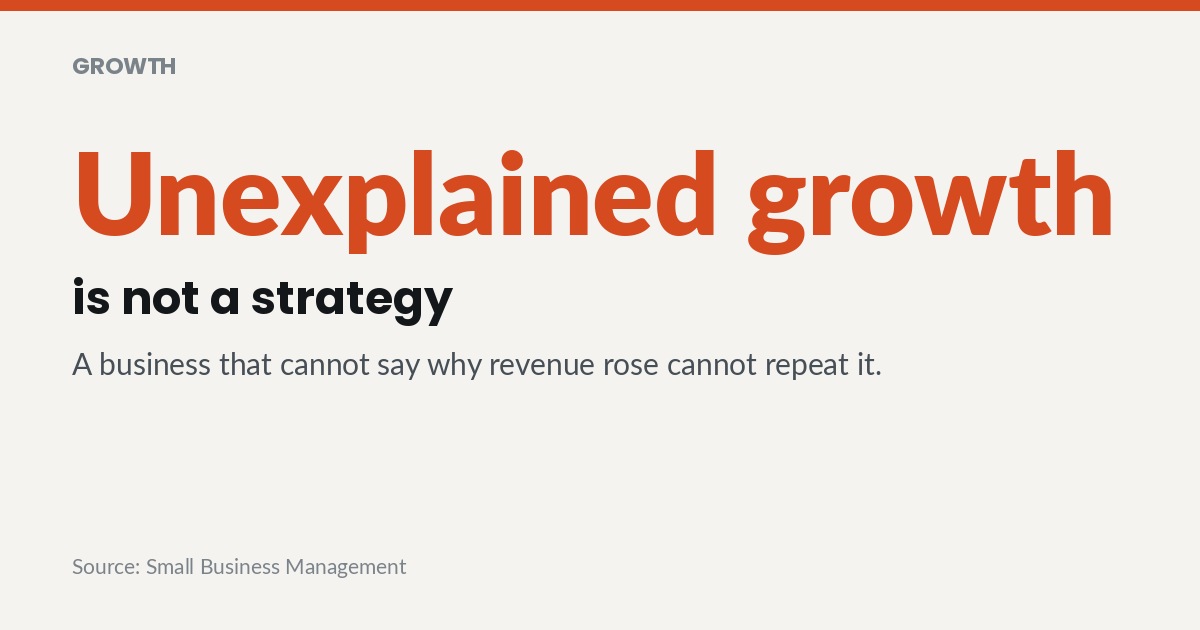
Unexplained growth is not a strategy. A business that cannot say why revenue rose cannot repeat it.

A small business growth strategy is only a strategy if the business can explain why revenue moved. Growth that cannot be traced to a specific cause cannot be repeated, defended or funded. Repeatability rather than size separates a growing company from a lucky one. The real work sits in the machinery behind the number.

The Difference Between Growth and Good Fortune

Revenue rises for many reasons and only some of them belong to the business. A strong quarter can come from a competitor closing, a referral nobody engineered, or a seasonal swing that reverses without warning. None of those causes can be scheduled again next year. An owner who cannot separate them will invest confidently in the wrong thing.

The test that matters is simple and rarely comfortable to run. If the last strong period had to be produced again on purpose, could the business name the actions that would do it? Distinguishing a business that has genuinely matured from one that has simply been fortunate begins with that question. Most owners find their answer describes conditions rather than actions.

Written strategy fails at the same seam and for the same reason. The thinking is usually sound while the machinery underneath it is usually missing. The reasons that well written strategies stall inside the mechanics of delivery have little to do with the quality of the analysis. They have everything to do with who owns each moving part and when.

A useful frame covers demand, delivery, cash and people together rather than one at a time. Reviewing the connected areas that decide whether a small business grows or merely survives keeps attention away from the single loudest problem. Growth breaks whichever of those four is weakest, not whichever gets discussed most often in meetings.

Owners who run that test honestly usually find one or two actions that genuinely worked. Those few actions are the real strategy, and everything else in the plan is decoration. The decoration can stay, provided nobody mistakes it for the engine.

The Machinery Underneath the Number

Sales pressure exposes operations long before it rewards them. New volume arrives at a delivery system built for the old volume, and quality falls before capacity is added. Customers then leave for reasons the sales team never hears about. The business concludes that the market softened and starts planning another campaign.

Scaling problems are structural rather than motivational, which is why additional effort does not resolve them. Working through the operational constraints that surface as soon as volume increases is what turns one good quarter into a good year. The constraints are usually known internally long before anyone names them in a meeting.

Communication is the constraint that hides best inside a growing company. As headcount rises, functions stop sharing context and each one optimises for its own measure. Repairing the communication breakdowns that appear between functions during scaling restores the shared picture that made the smaller version of the business work. Nobody notices the loss until a handover fails in front of a customer.

Handover points deserve specific attention because they are where information disappears. Work moving from sales to delivery, or from delivery to billing, crosses a boundary that no single manager owns. Most delays customers actually experience are created at those boundaries rather than inside any one function. Mapping them takes an afternoon and usually explains months of complaints.

Capacity is the other half of that problem and it is far easier to plan than to react to. Knowing how much extra volume the current team can absorb before quality slips is a number worth holding. Businesses that carry it can time hiring against demand rather than against exhaustion.

Demand Has to Be Built, Not Awaited

Owner-led firms often grow until the founder personally generates most of the demand. That arrangement works until the founder runs out of hours, at which point growth stops for a reason nobody records. The pipeline was never actually a system in the first place. It was one well connected person with a phone and a reputation.

Senior marketing judgment is what converts personal effort into a repeatable source of demand. The case for bringing executive marketing judgment into a business that cannot yet fund it full time rests on decision quality rather than campaign volume. Junior execution against an unclear strategy produces a great deal of activity and very little direction.

The distinction between marketing activity and marketing effect deserves far more attention than it usually receives. Focusing on the difference between marketing that runs and marketing that returns something forces every channel to justify its place in the budget. Channels that cannot be attributed belong in the experiment column rather than the commitment column.

Demand is only half the equation because price and mix decide what that demand is worth. Many businesses chase volume while quietly discounting away the margin that was funding the chase. Attention to the pricing, mix and retention levers that raise revenue without adding volume often produces a faster result than any new campaign.

Attribution does not have to be perfect before it becomes useful. A rough view of where enquiries originate is enough to stop funding the channels producing nothing. Precision can come later, once the obvious waste has been taken out of the budget.

Repeatability Inside Practice-Based Businesses

Professional and trade practices share one structural problem. The person delivering the work is also the person selling it, managing it and worrying about it. Growth therefore competes directly with delivery for the same finite attention. Adding clients without changing that structure simply raises the failure rate on both sides.

The pattern repeats across trades that appear to have nothing in common. Building a clinical practice that grows through referral systems rather than practitioner hours follows a familiar logic. The same reasoning shapes a legal practice where matter flow does not depend on one partner. In both cases the actual work is separating origination from delivery.

Project-based trades meet the same question on a different rhythm. Growth in a remodeling business, where scheduling and estimating decide profitability depends more on operating discipline than on lead volume. Winning more work while estimating badly accelerates the loss rather than the gain.

The common fix is to build the function that the owner currently performs by instinct. Referral generation, intake, scheduling and follow up can all be written down and handed to someone else. Once those exist as processes, capacity is added by hiring rather than by working longer hours. That is the point at which a practice becomes a business.

When Growth Depends on a Seat That Keeps Emptying

Some businesses build a functioning growth engine and then stand it on a role that turns over constantly. Retail motor is the clearest example, though the pattern appears wherever commission-led selling meets thin management support. The engine itself is real and generally well funded. The person operating it changes before anyone has learned how it works.

Marketing spend makes that exposure worse rather than better. Where advertising investment is handed to a sales floor that empties faster than it can be trained, the money buys leads that nobody is ready to work. The advertising is not being wasted by the market. It is wasted between the enquiry arriving and the first human response.

Stability at the management layer changes the arithmetic entirely. Understanding why the sales floor churns while the general manager stays in place points directly at what the retention problem actually is. The role that turns over is almost always the role with the least structure around it.

Repairing the engine means treating the whole sequence as a single system. Approaching dealership growth as a connected chain from advertising through to delivery exposes where the value is leaking away. Most operators find the leak sitting between the lead arriving and the first meaningful conversation.

Growth That Survives Its Own Expansion

Expansion multiplies whatever the business already happens to be. A company with unclear ownership of results does not gain clarity by adding a location, a product line or a country. It gains a second copy of the confusion and a longer delay before anyone notices.

Crossing a border sharpens that point considerably and quickly. Working through what has to be true internally before a business can sell into a new market usually reveals gaps that domestic trading had comfortably hidden. Regulation, payment terms and delivery expectations all change at the same moment.

Ownership of results is the one variable that travels well across a border. A business where each outcome has a named owner can copy itself into a new market without copying its ambiguity. Everything else about expansion is logistics, and logistics can be bought from someone else. Clarity about who owns a result cannot be bought at any price.

Sustainability is the quieter half of the growth question and the half that decides survival. Revisiting the durability questions that decide whether growth compounds or exhausts the business should happen while trading conditions are still good. Growth that consumes cash, goodwill and staff faster than it replaces them has a fixed ending.

The argument holds across every section above without much modification. A business that can name the cause of its last good quarter can deliberately build another one. A business that cannot is waiting for weather and calling the wait a plan. Owners who want growth to compound should spend less time forecasting the next number and more time understanding the last one.

Frequently Asked Questions

What makes a small business growth strategy repeatable?
Repeatability comes from knowing which specific actions produced the result. That requires tracking the path from demand generation through to delivery and payment. Once the path is visible, the business can increase the inputs that worked and stop funding the ones that did not. Without that visibility, every good quarter is a story rather than a method.

How can an owner tell whether growth is skill or luck?
The test is whether the last strong period could be reproduced on purpose. An owner who can name the actions, the owner of each action and the sequence has a method. An owner who describes market conditions and customer enthusiasm has a story instead. Both versions feel identical while revenue is rising.

When does hiring a fractional marketing executive make sense?
It makes sense once marketing decisions have become more expensive than marketing execution. Businesses running campaigns without a clear position, offer or channel logic are paying for activity alone. Senior judgment at part-time cost resolves the strategy before more money goes into delivery. Full-time hiring becomes sensible once the direction is settled.

Why does growth break operations before it breaks sales?
Sales capacity can be increased quickly because it responds to incentive and effort. Delivery capacity depends on process, staffing and systems that take much longer to change. New volume therefore arrives at a delivery function built for the previous volume. Quality falls, customers leave, and the cause is usually misread as market weakness.

Does the industry a business operates in change the growth strategy?
The tactics change while the underlying structure rarely does. Practice-based businesses have to separate origination from delivery, and volume businesses have to stabilise the roles carrying the work. Every sector still has to answer where demand comes from, what it costs and whether delivery holds. Industry knowledge decides how those answers are implemented, not whether they are needed.

What should be fixed first when growth has stalled?
Start with the transition points where work moves between people or functions. Handovers are where information is lost, delays accumulate and customers form their impression of the business. Fixing a handover usually costs nothing and produces a visible result within weeks. Larger structural work becomes easier to judge once those obvious losses are removed.
Tuesday, June 23, 2026

One in Three Dentists Has Idle Chair Time and Two in Five Cannot Staff a Hygienist

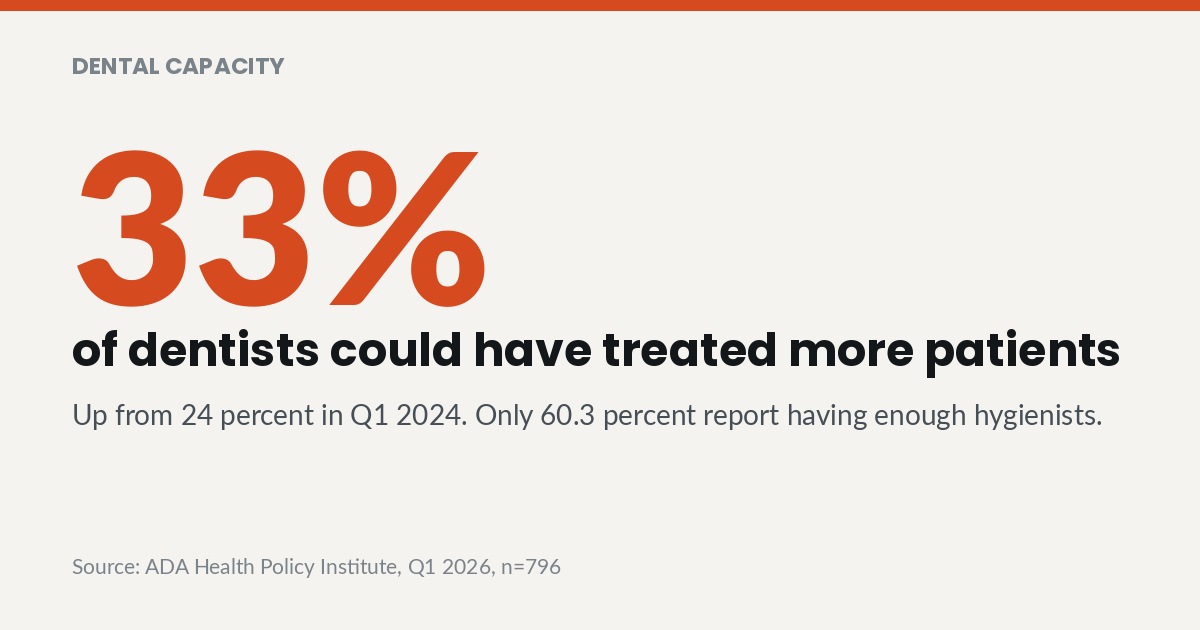
33% of dentists could have treated more patients. ADA Health Policy Institute, Q1 2026, n=796

Dental office management now has a capacity problem that looks like a demand problem. ADA Health Policy Institute data for Q1 2026 shows 33 percent of dentists report they are not busy enough, while only 60.3 percent report having enough hygienists. The empty chair and the unfilled hygiene role are usually the same problem.

Two numbers from one survey, usually read apart

The ADA Health Policy Institute publishes both findings in the same quarterly release. In Q1 2026, 33 percent of dentists said they were not busy enough and could have treated more patients, up from 24 percent in Q1 2024. The same survey, drawing on 796 responses, found 60.3 percent reported having enough hygienists.

Those two findings usually appear in separate summaries and separate conversations. Read together they describe a practice with open chair time and no clinician available to fill it. Idle capacity and an unfillable clinical role are not independent facts.

The distinction changes what a practice should spend money on. A practice reading idle chairs as weak demand buys new patient advertising. A practice reading the same signal as a labor constraint fixes the schedule and the staffing model instead.

Supporting evidence sits in the same ADA HPI release. ADA HPI found 73.5 percent of dentists reported enough dental assistants and 79.3 percent enough administrative staff in Q1 2026. The shortage concentrates in the clinical role that generates hygiene production rather than spreading evenly across the practice.

The recruiting market behind the gap

Dental practices are not passively accepting the shortage. ADA HPI reports 37.6 percent of dentists recruited a hygienist in the three months before the Q1 2026 survey. Of those recruiting, 90.5 percent rated the process very or extremely challenging.

Assistant recruiting follows a similar pattern with less intensity. ADA HPI found 36.7 percent recruited a dental assistant and 69.8 percent of those called it very or extremely challenging. Nearly every practice attempting to hire clinical staff is finding the market difficult.

The reason given is supply rather than price. ADA HPI reports 66.5 percent of dentists cited not enough applicants as the primary hygienist recruiting barrier, against 36.8 percent citing demand for high wages and benefits. A shortage of applicants does not respond to a wage increase the way a shortage of willing applicants does.

The benefit structure tells part of the story. ADA HPI found 42.6 percent of practices offer health insurance to staff in Q1 2026. A practice competing for a scarce clinician without offering health coverage is competing on wage alone against employers that do not have to.

The composition of the gap matters for hiring plans. ADA HPI puts administrative staffing at 79.3 percent adequate and assistants at 73.5 percent, against 60.3 percent for hygienists. A practice responding to the shortage by hiring at the front desk has solved a problem it did not have.

Owners frequently ask whether the shortage is temporary. Nothing in the recruiting data suggests a supply response is underway. When 66.5 percent of recruiting dentists point to applicant scarcity rather than wage demands, the pipeline itself is the constraint, and pipelines take years to refill.

Why the new patient budget is the wrong lever

Idle chair time reads as a marketing problem to most owners. The demand data does not support that reading. ADA HPI puts the new patient appointment wait time at 12.4 days in Q1 2026, down about two days from Q1 2024.

Shorter waits mean the schedule already has room in it. A practice with open availability and a marketing campaign will convert new patients into appointments the hygiene schedule cannot support. The bottleneck moves from acquisition to delivery without ever appearing in the marketing report.

The resulting failure mode is specific and costly. New patients arrive, complete an exam, and get placed on a hygiene recall the practice cannot honor within a reasonable window. Those patients leave through the back door while the front door spend continues.

Employment data confirms the sector is hiring rather than shrinking. BLS Current Employment Statistics for May 2026 put employment in offices of dentists at 1,062,300, up 1.7 percent year over year. Practices are adding people and still reporting they cannot fill the roles that matter most.

How the two constraints compound over a year

Hygiene is not only a revenue line on the schedule. It is the diagnostic channel through which most restorative treatment gets identified and planned. A practice short a hygienist loses the appointment where treatment planning normally happens.

The effect arrives with a delay, which is what makes it hard to see. Restorative production falls a quarter or two after hygiene coverage slips, by which point the owner has attributed the decline to the market. The causal chain runs backward from the schedule rather than forward from demand.

Adding new patients into that state makes the arithmetic worse rather than better. Each new patient consumes an exam slot and generates a recall obligation the practice cannot meet. The backlog grows, recall compliance falls, and the existing patient base absorbs the shortfall first.

ADA HPI data shows the idle capacity figure rising from 24 percent in Q1 2024 to 33 percent in Q1 2026. Over that same window, wait times fell and employment in offices of dentists rose. A sector adding staff while reporting more idle capacity is describing a mismatch between who gets hired and what is needed.

Wages are the visible lever and they are already moving

The wage picture explains why owners feel squeezed from both directions. The ADA HPI Survey of Dental Practice for 2025 puts the average hygienist hourly wage at $49.20, up 2.9 percent year over year, with full-time hygienists at $48.80. Average dental assistant wages reached $25.30, up 4.5 percent, with expanded-function assistants at $29.90.

That annual survey carries a 1.9 percent response rate, which is worth stating plainly. The figures work as directional benchmarks rather than as precise market rates. Practices setting compensation should read them alongside local market evidence rather than in place of it.

The monthly federal series points in the same direction. BLS Current Employment Statistics for May 2026 put average hourly earnings for production and nonsupervisory staff in offices of dentists at $34.75, up 4.1 percent year over year. Two independent sources showing wage growth in the same range is a real signal.

Real wage growth is a separate question from nominal growth. ADA HPI's State of the US Dental Economy for Q1 2026 describes dental staff wage growth as roughly zero in real terms. The trailing twelve month figure was nominal 2 percent against 2 percent inflation. Staff are not gaining ground, and owners are still paying more each year.

That combination explains why a pure wage response does not resolve the shortage. Everyone is raising wages, so relative position barely moves. Practices that win clinical hires compete on schedule, benefits and working conditions rather than on hourly rate alone.

Redesigning the staffing model instead of the marketing budget

The practical work sits in scheduling and role design. A hygiene schedule built around a single fixed appointment length wastes capacity on patients who need less and creates overruns on patients who need more. Practices that segment recall intervals by clinical risk recover chair time without hiring anyone.

Cross-training expands the assistant pool

Expanded-function assistants extend what a practice can deliver without a hygienist in every operatory. The ADA HPI Survey of Dental Practice for 2025 puts expanded-function assistant wages at $29.90 against the $49.20 hygienist average. State practice acts govern what is permitted, and the answer differs enough that no general rule applies.

Benefits are a recruiting instrument, not an expense line

With 42.6 percent of practices offering health insurance according to ADA HPI, a benefits package is a differentiator rather than a baseline. The cost is real, and the alternative is an unfilled operatory generating nothing at all. Practices that price the vacancy against the benefit cost reach a different conclusion than practices pricing the benefit alone.

Retention beats recruiting in this market

With 90.5 percent of recruiting dentists calling the hygienist search very or extremely challenging, the cheapest hire is the one already employed. Turnover in a scarce role costs weeks of lost production on top of the recruiting effort itself. Owners who cannot explain why their last clinical departure happened are managing the wrong end of the problem.

Owners who want the analysis done properly should treat it as an operations question rather than a marketing one. Chair use, provider schedules, recall compliance and staffing ratios belong on one page together. Practices needing outside help building that view often start with a management consulting engagement focused on operational capacity rather than another marketing vendor.

The jump from 24 percent to 33 percent of dentists reporting idle capacity in two years is not a demand story. Patient demand did not fall while wait times shortened and employment rose. What changed is the ability of a practice to convert existing demand into delivered care.

That reframing changes the budget conversation for the year. A dollar spent on hygiene capacity, schedule design or clinical retention returns more than a dollar spent attracting patients the practice cannot see. The constraint sits on the supply side of the operatory, and no marketing plan can reach it.

Frequently Asked Questions

How do I tell whether my open chair time is a demand problem or a staffing problem?
The test is whether the practice could deliver more care if a patient appeared tomorrow. A schedule with open operatory hours but no available hygienist is a capacity problem regardless of how it reads on a production report. ADA HPI data for Q1 2026 shows 33 percent of dentists report they are not busy enough while only 60.3 percent report enough hygienists. Practices should map open chair hours against staffed clinical hours before approving any new marketing spend.

Should my practice raise hygienist wages to fill the role?
Wage increases address the wrong barrier for most practices. ADA HPI found 66.5 percent of dentists cited not enough applicants as the primary hygienist recruiting barrier, against 36.8 percent citing demand for high wages and benefits. Raising pay in a market where every employer is raising pay changes relative position very little. Schedule flexibility, benefits and working conditions move candidates further than an hourly adjustment does.

Is it worth investing in expanded-function dental assistants?
Expanded-function assistants extend clinical delivery at a materially lower wage point. The ADA HPI Survey of Dental Practice for 2025 puts expanded-function assistant wages at $29.90 against a $49.20 average for hygienists. State practice acts determine which procedures are permitted, and the variation is wide enough that each practice must check its own rules. That survey carries a 1.9 percent response rate, so the wage figures serve as directional benchmarks rather than precise market rates.

How should my practice be measuring chair use?
Use should be measured against staffed clinical hours rather than against building hours. A practice open five days with hygiene coverage on three is running at full clinical capacity while looking idle on a facility-hours basis. Tracking scheduled hygiene hours, completed hygiene hours and open recall gaps gives a truer picture of capacity. The distance between those figures is the production a practice can recover without hiring anyone.

Does a shorter new patient wait time mean the practice needs more marketing?
Shorter waits indicate available appointment slots rather than weak underlying demand. ADA HPI reports new patient appointment wait time at 12.4 days in Q1 2026, down about two days from Q1 2024. Availability created by schedule gaps rather than by added capacity will fill and then overflow into a hygiene backlog. Practices should confirm the recall schedule can absorb new patients before spending to attract them.

What is the first operational change a short-staffed practice should make?
Recall interval segmentation returns the most capacity for the least investment. Assigning hygiene intervals by clinical risk rather than by a uniform default frees appointment time for the patients who need it. The second change is a documented retention conversation with every clinical employee, since ADA HPI found 90.5 percent of recruiting dentists rated the hygienist search very or extremely challenging. Replacing a clinician in that market costs far more than keeping one.

Tuesday, September 16, 2025

Dealerships Spend $739 Per Car on Advertising and Hand the Leads to Someone Who Leaves in Just Over Two Years

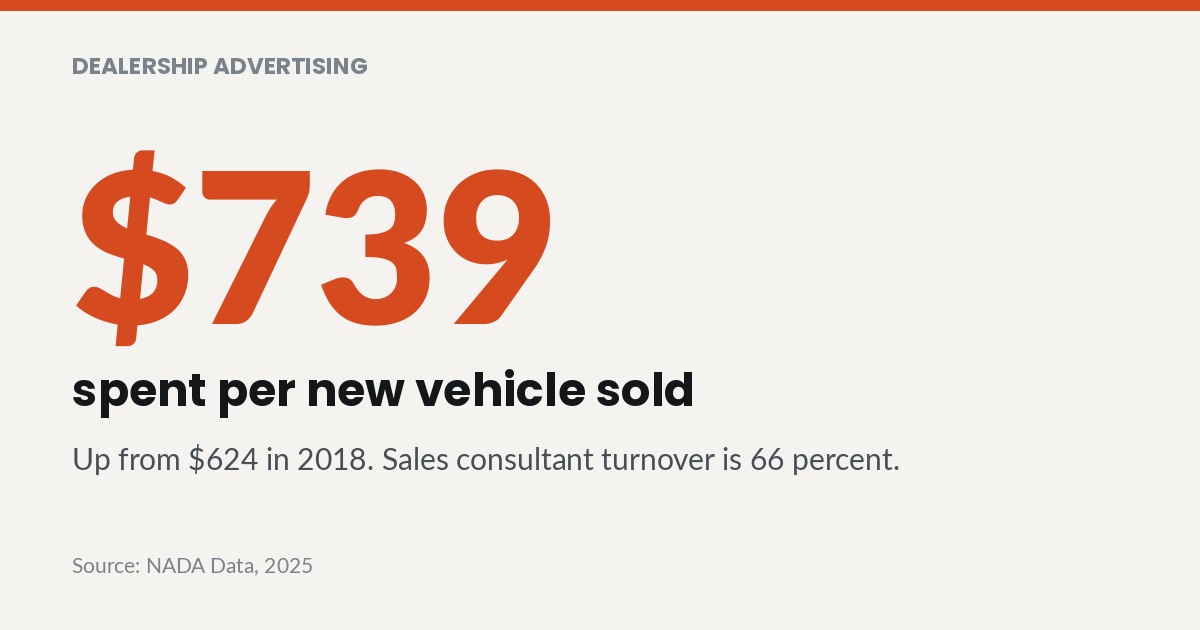
$739 spent per new vehicle sold. NADA Data, 2025

Auto dealer marketing has an allocation problem on the back end, not the front end. NADA Data for 2025 puts advertising expenditure at $739 per new vehicle sold, up from $705 in 2024. Those leads arrive at a sales floor with 66 percent annual consultant turnover. The spend is not the weak link, the handoff is.

The spend is at a record and the mix is defensible

NADA Data for 2025 puts advertising expenditure per new vehicle sold at $739, up from $705 in 2024 and $624 in 2018. Total dealership advertising expenditure reached $9.96 billion, averaging $586,246 per dealership. Neither figure suggests a dealer body that is underinvesting.

The channel allocation has modernized along with the buyer. NADA Data for 2025 breaks the advertising mix out by channel.

  • Search engine marketing at 21.1 percent
  • Third-party listing sites at 20.0 percent
  • Search optimization and website at 19.5 percent
  • Social at 14.2 percent
  • Television at 10.5 percent
  • Radio at 6.9 percent
  • Direct mail at 5.6 percent
  • Newspaper at 2.1 percent

In dollar terms per dealership, NADA Data for 2025 records $123,698 on search engine marketing, $117,249 on third-party listings and $114,318 on search optimization and website. Social absorbed $83,247 and television took $61,556 per store. Digital channels dominate, which is the correct answer given where shoppers begin.

The trajectory matters as much as the level. Advertising expenditure per new vehicle sold ran $624 in 2018 and $705 in 2024 before reaching $739 on NADA Data for 2025. Spend per unit has climbed steadily while the organization receiving those units has not become more stable.

A dealer reviewing that mix will find very little to cut. The problem is not that the money goes to the wrong channels. The problem is what happens after the channel does its job.

The receiving organization turns over every two years

The NADA Dealership Workforce Study for CY2024 covers more than 250,000 payroll records across 1,713 same-store dealerships. It puts sales consultant turnover at 66 percent, median tenure at 2.2 years and three-year retention at 44 percent. Total dealership turnover across all departments is 42 percent on the same study.

Those figures describe a sales floor where most people handling leads this quarter were not there two years ago. Product knowledge, process knowledge and customer relationships all reset at that rate. The advertising does not reset, it keeps arriving at the same speed.

A lead is a perishable asset that requires a trained human to convert. Routing a record-level advertising budget into a workforce that replaces itself every couple of years is a design decision, whether or not anyone made it deliberately. The cost shows up as leads that never receive a second contact.

What turnover does to a lead in practice

Turnover damages lead handling in ways that never appear in a marketing report. A new consultant does not know the inventory well enough to answer a specific question quickly. Response time slips, and the shopper who submitted three inquiries buys from whichever store answered first.

Process discipline is the second casualty of churn. Customer relationship management systems only work when the people entering data believe the data matters. A consultant early in a job that most people leave inside three years enters what is required and nothing more.

Follow-up is the third casualty and the most expensive. Sold and unsold follow-up sequences depend on ownership of a customer over months. Turnover breaks that ownership, and orphaned records sit in the system as evidence that the advertising worked and the process did not.

Managers absorb the difference by working the floor themselves. That is a common response, and it caps the store at whatever the manager can personally handle. The advertising budget scales, and the human capacity behind it does not.

Digital retailing tools were supposed to reduce the dependence on floor talent. In practice they move part of the transaction online and hand the remainder back to the same consultant. A shopper who configures a deal online and then meets an untrained salesperson experiences the discontinuity as a broken store.

The per-salesperson math makes the exposure visible

NADA Data for 2025 puts new vehicle sales per salesperson at 114 per year and used at 139. Those are the units carrying the advertising spend. A store losing a consultant loses a share of that production while the replacement learns the job.

The transaction values involved raise the stakes considerably. NADA Data for 2025 records an average new vehicle retail selling price of $48,205 and an average used price at franchised dealerships of $28,680. Every mishandled lead is a transaction of that size that went somewhere else.

Store-level economics make the same point at scale. NADA Data for 2025 puts average dealership sales at $76,603,000, with a revenue mix of 54.9 percent new, 31.8 percent used and 13.3 percent service and parts. A store of that size runs on process rather than on individual talent.

The industry is large enough that the pattern is structural rather than local. NADA and BLS figures for 2025 count 16,990 franchised light-vehicle dealerships employing 1,123,100 people, averaging 65 per store. A store of that headcount cannot rely on informal knowledge transfer to protect its lead flow.

Cost per sale is the number that connects the two halves of the problem. A store can compute it from its own advertising spend and its own delivered units without any industry data. Watching that figure move as lead handling improves tells a dealer more than any channel report will.

Fixed operations shows what a retained relationship is worth

The service drive offers a useful contrast here. NADA Data for 2025 shows dealerships wrote 16,252 repair orders each, generating $9,687,942 in service and parts sales at $494 per customer repair order. That revenue comes from customers the store already acquired.

Service and parts contributes 13.3 percent of revenue on the NADA mix while generating a far more durable customer relationship. The department runs on appointment discipline, capacity planning and follow-up, which are exactly the practices the sales floor struggles to maintain. The difference is staffing stability rather than channel strategy.

Retention economics also explain why service traffic is worth protecting during a sales downturn. A customer retained in service returns on a defined cadence with no advertising spend attached to the visit. Sales acquisition, by contrast, restarts from zero on every single deal.

A dealer looking for a template for lead handling has one inside the building. Service advisors work a structured process with defined touchpoints and measured outcomes. The sales department buys traffic at $739 a car and then handles it with far less structure.

Fixing the handoff instead of the media plan

The fix is unglamorous and it is not a vendor purchase. A dealership with 66 percent sales turnover has to build a process that survives the person executing it. That means the process has to be written, trained and measured rather than transmitted informally.

Response time as a managed metric

Speed to first contact determines which store gets the appointment. A store measuring response time by lead source, by hour and by individual has something it can manage. A store measuring monthly averages has a number that hides every failure inside it.

Appointment set rate before close rate

Close rate is a lagging measure that mixes lead quality with sales skill. Appointment set rate isolates the part of the process the store actually controls. Dealers tracking set rate by source can tell whether the money bought bad leads or the floor handled good ones badly.

Onboarding built for a workforce that turns over

With median sales consultant tenure at 2.2 years on the NADA study, onboarding is a permanent function rather than an occasional event. A store that gets a new consultant productive in weeks instead of months recovers a large share of the turnover cost. Training built once and delivered continuously outperforms training assembled each time someone quits.

Lead ownership that survives a departure

Most stores assign a lead to a person and lose the thread when that person leaves. Assigning leads to a queue with a named owner and a documented reassignment rule keeps the record alive. With turnover at 66 percent on the NADA study, reassignment is a routine event rather than an exception.

Attribution deserves a discipline of its own inside the store. A store that cannot connect a sale back to a lead source is guessing at $586,246 of annual spend. Dealers who want that connection built properly often start with a management consulting engagement covering sales process and operations rather than another marketing vendor.

The advertising number and the turnover number belong in the same conversation. NADA Data puts the spend at $739 per new vehicle sold, and the NADA Dealership Workforce Study puts sales consultant turnover at 66 percent. Reviewing one without the other produces a media plan and no improvement.

Dealers have spent years optimizing the top of the funnel with genuine skill. The mix is modern, the budgets are serious and the channels are measured. What remains unoptimized is the moment a lead becomes a specific person's responsibility, and that moment decides the return on every advertising dollar.

Frequently Asked Questions

Is my dealership spending too much on advertising?
The spending level at most stores sits close to industry norms rather than above them. NADA Data for 2025 puts advertising expenditure at $739 per new vehicle sold and $586,246 per dealership on average. A store materially above those figures should examine its channel mix, and a store well below them should examine its market coverage. The more productive question is what happens to the leads that spend generates.

Which advertising channels deliver the best return for a dealership?
Channel performance depends on the store, the brand and the market rather than on a universal ranking. NADA Data for 2025 shows the industry mix at 21.1 percent search engine marketing, 20.0 percent third-party listing sites and 19.5 percent search optimization and website. Those three channels dominate because shoppers begin there. No store can answer the return question without attribution connecting closed sales back to source.

How much does sales turnover actually cost a store?
The cost appears as lost production rather than as a recruiting line item. NADA Data for 2025 puts new vehicle sales per salesperson at 114 per year and used at 139. A vacancy or a ramping replacement removes a share of that production while advertising spend continues unchanged. The NADA Dealership Workforce Study puts sales consultant turnover at 66 percent with median tenure of 2.2 years.

Should a store fix lead handling before increasing the marketing budget?
Extra spend poured into an unchanged process produces proportionally more waste. A store should confirm that response time, appointment set rate and follow-up completion are measured and acceptable first. Once those are stable, additional advertising converts at a known rate rather than an assumed one. The sequence protects the incremental budget from the bottleneck that already exists.

What should my store measure to know the lead process is working?
Response time to first contact, appointment set rate by source and appointment show rate cover most of it. Those three measures isolate the part of the funnel the store controls, separate from lead quality. Close rate matters but arrives too late and mixes too many variables to direct daily behavior. Each measure should be visible by individual and by lead source rather than as a store average.

How does fixed operations relate to the marketing problem?
Service demonstrates what a structured process produces with the same customer base. NADA Data for 2025 shows dealerships wrote 16,252 repair orders each, generating $9,687,942 in service and parts sales at $494 per customer repair order. That revenue comes from customers already acquired and retained through defined appointment and follow-up processes. Sales departments that borrow that structure convert more of the traffic advertising has already bought.

Monday, December 23, 2024

Proven Strategies to Grow Your Acupuncture Business

 The global acupuncture market is experiencing significant growth, with projections showing an increase from $31.2 billion in 2021 to $52.7 billion by 2028. This reflects a growing demand for alternative therapies as more people prioritize wellness and complete health solutions. If you want to expand your acupuncture business, here are four actionable strategies to help you tap into this thriving market.

1. Identify and Use Market Opportunities

Acupuncture is becoming increasingly popular as people seek alternatives to traditional pain management and healthcare solutions. Understanding market trends and positioning your services as solutions to chronic pain, stress, and overall wellness can set you apart. Highlighting acupuncture’s ability to address specific issues like back pain or migraines will resonate with potential clients searching for targeted solutions.

2. Focus on Client Satisfaction

A remarkable 80% of patients report significant pain relief through acupuncture treatments, demonstrating the importance of client satisfaction. Happy clients are more likely to leave positive reviews, refer friends, and return for additional treatments. Building trust through personalized care and regular follow-ups can turn one-time visitors into lifelong advocates for your business.

3. Invest in Effective Marketing Strategies

Referrals remain the backbone of acupuncture clinic growth, with 60% of clinics citing them as their most effective marketing channel. Focusing on exceptional customer service and building strong relationships ensures your clients become ambassadors for your brand. Developing a professional website and engaging on social media platforms can also attract new clients and enhance your clinic's visibility.

4. Promote Wellness Education

Educational workshops are a powerful way to increase patient engagement, with studies showing a 25% boost in participation rates when clinics offer them. Hosting events such as stress management seminars, nutrition classes, or introductory acupuncture sessions can attract new clients while positioning your business as a trusted authority in wellness practices. These events also provide an opportunity to cross-promote other services.

Final Thoughts

Growing an acupuncture business involves more than offering effective treatments. It involves creating meaningful connections with your clients, using market trends, and embracing educational opportunities. By implementing these strategies, you can strengthen your reputation, attract new clients, and achieve sustainable growth in a competitive industry.


Strategies to Successfully Grow a Small Law Firm

 Growing a small law firm in today’s competitive landscape requires a combination of traditional practices and modern innovations. Law firms must adapt to evolving client expectations and use digital tools effectively to stand out. Here are four actionable strategies to help small law firms achieve sustainable growth.

1. Prioritize Effective Marketing Strategies

For small law firms, referral-based marketing remains a cornerstone of success, with 70% of firms finding it the most effective method of acquiring clients. This approach highlights the importance of client satisfaction and networking. Building strong relationships with clients and encouraging them to share their experiences can significantly boost referrals. Additionally, attending industry events and community gatherings can further expand your firm’s visibility and connections.

2. Strengthen Your Online Presence

In a digital-first world, 80% of clients search for attorneys online before deciding. An engaging, user-friendly website and search engine optimization (SEO) can help your firm stand out. Include well-crafted blog posts, case studies, and testimonials to demonstrate your expertise. Investing in local SEO ensures that your firm appears in search results when potential clients in your area seek legal assistance.

3. Focus on Client Retention

Retaining clients is not only cost-effective but also vital for long-term success. Strong, lasting relationships build trust and loyalty, encouraging repeat business and referrals. Regular follow-ups, personalized updates on case progress, and a commitment to resolving client issues quickly can enhance satisfaction. A well-maintained relationship with clients fosters a positive reputation for your firm.

4. Use Digital Tools for Efficiency

Digital tools are game-changers for law firms aiming to streamline operations and improve client communication. Email marketing, for instance, offers an impressive ROI of 4200%. Regular newsletters, legal updates, and reminders can keep your firm at the forefront of clients' minds. CRM software and scheduling tools can also help manage client relationships effectively, ensuring no lead or case falls through the cracks.

Conclusion

Small law firms that embrace a mix of traditional marketing, digital strategies, and client-centric approaches are better positioned to grow in a competitive market. Your firm can achieve sustainable growth and success by fostering strong relationships, optimizing online presence, and using technology.


Unlocking Growth in the Kitchen Remodeling Industry: Strategies for Success

 The kitchen remodeling industry is flourishing, with a projected CAGR of 4.5% from 2021 to 2028. As rising homeownership rates fuel demand for modern, functional kitchen designs, contractors and remodeling businesses are uniquely positioned to capitalize on this growth. However, achieving long-term success requires more than technical expertise. It demands strategic planning and innovative approaches. Below are five proven strategies to effectively grow a kitchen remodeling company.

1. Use Industry Growth Trends

Understanding and adapting to market trends is the cornerstone of success. The consistent growth in kitchen remodeling reflects a surge in consumer interest in modern, aesthetically pleasing spaces. Remodeling companies must stay ahead of these preferences, offering cutting-edge design options and energy-efficient solutions. Providing services that align with contemporary demands positions your company as a leader in a competitive market.

2. Harness the Power of Digital Marketing

Digital marketing has become indispensable in driving leads and generating awareness. Research shows that digital strategies can produce three times as many leads as traditional advertising methods. From SEO-optimized websites to targeted pay-per-click (PPC) campaigns, creating a strong online presence is key. Demonstrate your portfolio, highlight customer testimonials, and maintain an active blog to attract potential clients organically.

3. Prioritize Customer Reviews

Positive reviews are a powerful tool in building credibility and trust. A staggering 79% of consumers rely on online reviews as much as personal recommendations when choosing a service provider. Encouraging satisfied customers to leave feedback on platforms like Google, Yelp, or Houzz enhances your reputation and helps you stand out. Additionally, addressing negative feedback constructively demonstrates accountability and dedication to customer satisfaction.

4. Embrace Visual Social Media Platforms

Platforms like Instagram and Pinterest have revolutionized how remodeling companies demonstrate their work. A visually compelling feed can boost project inquiries by up to 20%, making social media an essential marketing channel. Share high-quality images, short video walkthroughs, and client testimonials to engage your audience. Use hashtags strategically to reach homeowners actively searching for remodeling inspiration.

5. Understand and Communicate Project Costs

Clear communication about project costs is essential to managing client expectations and building trust. On average, a kitchen remodel costs around $25,000 and can recoup up to 80% of the investment in home resale value. Highlighting the value and long-term benefits of remodeling projects can reassure hesitant clients and establish your company as a transparent and reliable partner.

Final Thoughts

Growing a kitchen remodeling company in today's dynamic market requires more than skilled craftsmanship. Businesses can carve out a competitive edge by staying attuned to industry trends, using digital tools, and prioritizing customer engagement. Take proactive steps to integrate these strategies into your operations, and watch your kitchen remodeling business thrive in the future.

Ready to transform your kitchen remodeling business? Get in touch today for tailored strategies to maximize your growth potential.


Thursday, November 28, 2024

Benefits of hiring of a Fractional Chief Marketing Officer

Hiring a fractional CMO provides businesses with cost-effective marketing expertise, saving 50 to 75% compared to a full-time executive. This allows startups and small businesses to allocate resources more efficiently. Fractional CMOs bring years of industry experience, offering strategic guidance that helps brands adapt swiftly to market changes. Their flexibility and scalability enable businesses to align marketing efforts with growth needs without long-term commitments. Additionally, internal teams can focus on core objectives better, leading to a 28% productivity boost. These benefits make fractional CMOs invaluable for driving growth and achieving marketing excellence.


Friday, October 25, 2024

Fractional Chief Marketing Officer - Maximizing Marketing Impact

A Fractional Chief Marketing Officer (CMO) offers businesses top-tier marketing leadership on a part-time or project basis. This presentation highlights the role and benefits of hiring a fractional CMO, including strategic planning, cost-effectiveness, and immediate results. Learn how companies can scale their marketing efforts efficiently by using expert guidance without the commitment of a full-time executive.