Showing posts with label People and Culture. Show all posts

Tuesday, July 28, 2026

The Leadership Gap Between Deciding and Getting It Done

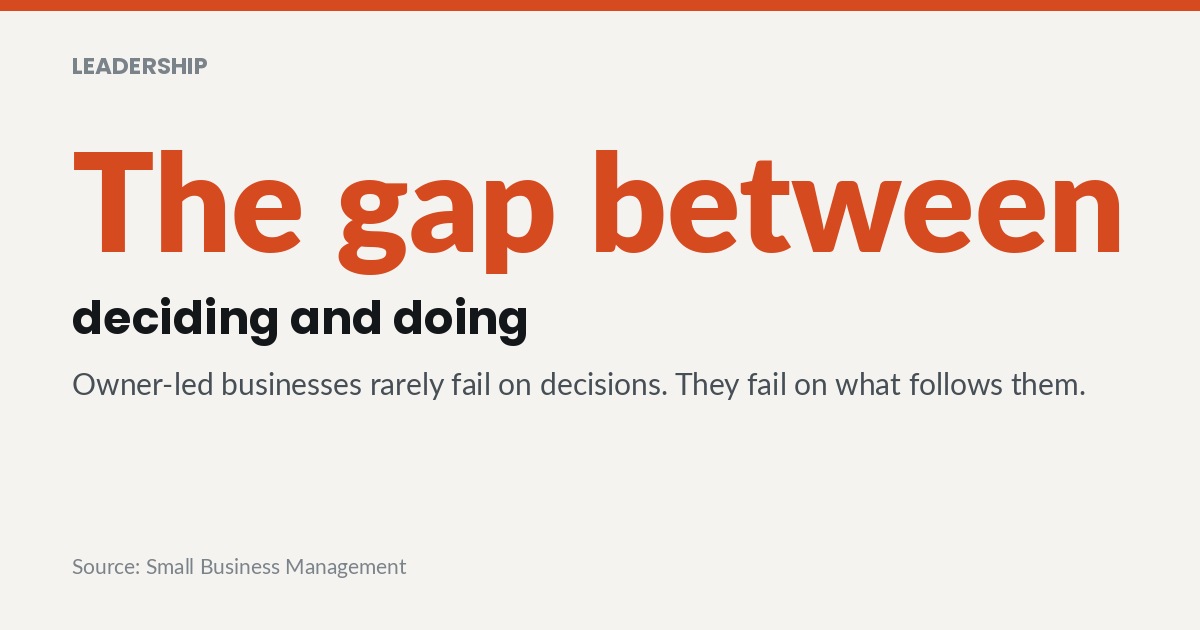
The gap between deciding and doing. Owner-led businesses rarely fail on decisions. They fail on what follows them.

Small business leadership fails less often at the point of decision than at the point of follow through. The owner chooses correctly, states the choice clearly, and then watches the organisation continue exactly as before. The real work of leadership sits inside that gap. Closing it takes structure, delegation, and conditions that make new behaviour survivable.

The Gap Between the Decision and the Behaviour

Most owner-led businesses do not suffer from a shortage of good decisions. They suffer from decisions that were announced once and never converted into daily behaviour. The meeting ends, the calendar refills, and the previous routine quietly reasserts itself. Nothing formally reverses the decision, and nothing formally enacts it either.

The gap has a recognisable shape in almost every business. It opens wherever a decision lacks a named owner, a first action, and a visible consequence for inaction. Each of those three absences can be repaired in an afternoon. What allows them to persist is that no single missed follow up looks like a failure at the time.

Treating leadership as a daily operating practice rather than a personality trait is the starting position for everything that follows. The habits involved are ordinary, repeatable and unglamorous. Owners who want a faster entry point can work from a set of practical habits that keep a small operation from drifting week to week.

The skill under discussion is operational rather than inspirational. It appears as the ability to convert intent into sequence, owner and date. Sharpening the operational side of leading, where intent becomes sequence and accountability produces faster change than any restatement of vision.

Who Owns Execution After the Meeting Ends

Execution has an owner or it does not happen at all. In most small businesses that owner is the founder by default, which is precisely the problem. The founder holds the least available attention and the most competing claims on it. Adding another decision to that queue changes nothing about the queue.

This is why the operating role has become a serious question for firms well below enterprise scale. The role itself has changed shape over the past decade. The different kinds of operating executive a business can actually use vary far more than the shared title suggests.

A builder, a fixer and a scaler solve genuinely different problems. Hiring the wrong one can waste an entire year of momentum. The choice depends on what stage the business has actually reached rather than what stage it describes.

Partnership at the top matters as much as the job title does. Where the owner and the operator drift apart, the organisation receives two competing versions of every priority. Getting the division of labour between the visionary seat and the execution seat right removes a large share of internal confusion before it starts.

Part-time operating support has made senior help reachable for smaller firms, though the language around it is used loosely. The distinction that matters is accountability rather than hours worked. The difference between an embedded operator who carries the outcome and a vendor who delivers a service decides whether change survives.

Project work exposes that difference faster than anything else. Applying senior operating attention to project delivery rather than project reporting changes what gets escalated and when it gets escalated. Reporting describes the gap in careful and reassuring language. Operating closes the gap and then reports on it afterwards.

Outside help carries a failure mode of its own. An adviser paid to agree is an expensive form of comfort. The value sits instead with an outside voice willing to stress test the plan rather than applaud it.

Owners rarely need more encouragement than they already have in abundance. They need someone who will find the assumption that nobody has tested yet.

Strategic input works the same way when it is bought properly. The argument for bringing structured outside thinking in before capital is committed rests on sequencing rather than raw intelligence. A worked account of how operating leadership gets introduced into a small business in its first quarter shows what the sequence looks like in practice.

Delegation Is a Structure, Not a Gesture

Delegation fails most often because it is treated as an act of generosity. Work is handed over without the authority, information or tolerance for error that would let someone carry it. The founder then reclaims the work, concludes that nobody else can do it, and the ceiling stays exactly where it was.

Handing over high consequence operations is a different exercise from handing over tasks. The route from founder overload to a genuine transfer of high stakes operations depends on defining decision rights before the work moves. Control is then retained through visibility rather than through involvement.

The layer receiving delegated work is usually the weakest part of a small business. Middle managers are promoted for technical strength and then asked to lead without any preparation for it. Strengthening the management layer that has to translate direction into daily work is where most delegation efforts either succeed or quietly collapse.

Delegation also extends outward to everyone affected by a decision. Suppliers, lenders, partners and long standing customers all shape whether a change survives contact with reality. Planning how affected parties are informed and involved before a change lands prevents resistance that would otherwise arrive at the worst moment.

Capacity problems reveal the same gap in a form that can be counted. A practice can be fully staffed, fully booked on paper, and still lose hours that nobody is accountable for. Examining unused capacity sitting inside an apparently busy schedule shows how an operational leak survives simply because no single person owns it.

A useful test is whether the founder could be unreachable for a full week without decisions stalling. Businesses that pass that test have distributed decision rights rather than workload. Businesses that fail have handed out the labour while keeping every judgment call at the top.

The Conditions That Let People Act

Behaviour changes only when the environment makes the new behaviour safe. Staff who expect blame for an honest error will route around a decision rather than test it openly. The organisation then looks compliant while quietly protecting itself from the change.

That is the practical case for an environment where raising a problem early carries no penalty. Silence is not agreement, and it is usually the most expensive signal inside a business. Owners who punish bad news receive less of it and learn about failure much later.

Change itself demands a different posture from the person leading it. Directive leadership works well when the answer is already known and fails badly when it is not. Adopting a stance that adjusts as a change initiative reveals new information keeps a plan honest while conditions move underneath it.

The interpersonal side of this is not decoration. Reading a room accurately determines whether an owner hears the real objection or the polite one. That is why the ability to read and regulate reactions under pressure belongs in any operating discussion. The related discipline of understanding the pressure a decision creates for the people executing it is equally practical rather than sentimental.

Disengagement is the visible residue of these failures. Staff who do exactly what is asked and nothing further are usually responding to something specific and recent. Reconsidering what withdrawn discretionary effort actually signals about management is more useful than treating the pattern as a generational complaint.

Measuring Leadership Without Fooling Yourself

Leadership is measured badly in most small businesses, or it is not measured at all. The default proxy is revenue, which moves for many reasons unrelated to how the business is led. A better approach separates what the leader did from what the market did.

Structured assessment helps when the output is read honestly. A view of where a leader's natural strengths and blind spots actually sit gives a starting point that self perception rarely provides. The caution is that instruments flatter their subjects when nobody interrogates the result. The uncomfortable findings a popular assessment tends to leave unsaid deserve attention before any results are circulated.

Measurement culture matters more than any single instrument ever will. A business that decides by instinct at the top will not become evidence led further down. Building the habit of deciding from evidence rather than from seniority begins with the owner accepting correction from a number.

Development is the other half of measurement and the half most often skipped. Identifying a weakness without a plan to close it produces anxiety instead of progress. Treating the deliberate building of leadership capability as an operating investment converts assessment into capability across a year rather than a workshop.

Cadence is what makes any of this real rather than theoretical. A leadership review held once a year describes history instead of steering the business. A short monthly check on what was decided and what actually changed keeps the gap narrow enough to close.

New tools raise the stakes on judgment rather than removing the need for it. Automated systems now shape hiring, scheduling and performance review inside quite small firms. Working through the ethical questions that arrive when software starts making decisions about people has become part of the ordinary operating job.

The through line across all of this is deeply unglamorous. Deciding is cheap, announcing is cheaper still, and the entire cost of leadership sits in what happens afterwards. A business improves when someone owns the follow through, the middle layer is strong enough to carry it, and honest reporting is safe. Owners who close that gap rarely need better ideas than the ones already sitting in front of them.

Frequently Asked Questions

What is the single biggest leadership mistake small business owners make?
The most common mistake is treating a decision as finished once it has been communicated. Nothing about an announcement assigns ownership, sets a first action, or creates a consequence for inaction. Work then reverts to the previous routine while everyone assumes the change is underway. The repair is procedural rather than motivational and takes very little time.

How is a fractional operating executive different from a consultant?
A consultant is accountable for a deliverable such as a plan, an analysis or a recommendation. An operating executive is accountable for the outcome that the plan was meant to produce. That difference changes what happens when something goes wrong at an inconvenient hour. Owners should decide which form of accountability they are actually buying before signing anything.

When should an owner start delegating operational work?
Delegation should begin before the owner becomes the bottleneck rather than after. Waiting until capacity is exhausted forces a rushed handover with no defined decision rights. Effective transfer starts with naming which decisions move, which stay, and what visibility the owner retains. The receiving manager also needs preparation, not just permission.

Can leadership performance be measured in a small business?
It can, provided revenue is not used as the only proxy. Useful measures include how quickly decisions convert into visible action and how often problems surface early. Structured assessment adds a view of individual strengths and blind spots when the results are read critically. The measurement only matters if a development plan follows it.

Why do middle managers struggle so often in growing small businesses?
Most were promoted for technical ability and given no preparation for leading others. They inherit responsibility for translating direction into daily work without the authority to make that translation stick. The result looks like poor management but is usually poor design. Strengthening that layer is normally the highest return leadership investment available.

Does workplace culture really affect execution, or is it a soft concern?
Culture determines whether staff report a problem early or hide it until it becomes expensive. A team that expects blame will comply visibly and resist quietly, which stalls any change. Psychological safety is therefore an operating condition rather than a comfort. Owners who want faster execution should look at what happens to the person who delivers bad news.

Friday, July 17, 2026

5 Harsh Truths Your Company’s Favorite Assessment Is Hiding From You


1. Introduction: The Leadership Blind Spot

Every leader operates with a specific "slice of truth." It is like looking through a keyhole and assuming you see the entire room. The gap between what leadership believes is happening and the reality of the organizational machine is where growth goes to die.

The problem is not a lack of data. It is a lack of objectivity. Most leaders choose assessment tools based on tribal familiarity rather than business necessity. HR departments reach for engagement surveys because they want to be liked. Founders reach for internal frameworks because they want to be right. And boards hire high-priced consultants because they want to be safe.

This post distills the most counterintuitive takeaways from the world of organizational diagnostics to help you avoid expensive selection errors. To build a resilient company, you must stop buying the tool you are comfortable with and start buying the one that reveals the truth you are currently ignoring.

2. Takeaway 1: Sentiment is a "Comfort Metric," Not a Strategy

Employee survey platforms, engagement surveys, pulse tools, and culture diagnostics, measure how people feel. While morale matters, sentiment is a lagging indicator of organizational health and a leading indicator of resignations.

The harsh truth? You can have green scores on a broken strategy. A team can be perfectly happy, well-fed, and highly engaged while marching the company off a cliff. Using a sentiment survey to diagnose a business problem is a fundamental category error. These tools are excellent for predicting turnover, but they are entirely blind to the structural rot that causes turnover in the first place.

"Surveys without visible follow-through actively damage trust."

If you are over 50 employees, use these to keep a pulse on your people, but never mistake "happy employees" for a "healthy business."

3. Takeaway 2: Self-Awareness Will not Save a Broken System

Individual and team psychometrics, personality profiles, 360s, and communication frameworks, are designed to fix people. They are the favorite tool of the "enlightened" executive team. However, a leadership team can be exceptionally self-aware and communicative while presiding over undocumented processes and a strategy no one can repeat.

Psychometrics improve the conversation, but they say nothing about the system. A specific risk these tools miss is "founder dependency." This is not just a personality trait. It is a structural failure that concentrates all operational risk into one person. You can have the most self-actualized founder in the world, but if the business cannot run without them, the "system" is failing regardless of how high their EQ is.

4. Takeaway 3: The High Cost of the "Tribal" Selection Error

Selection errors usually follow tribal lines, and each comes with a specific cost-to-time trade-off.

  • The HR Tribe (Surveys): Costs $ and runs ongoing. It captures sentiment but misses structure.
  • The Founder Tribe (Framework Self-Audits): Costs nothing and takes hours. However, a SWOT session is only as good as the "room’s honesty." It lacks objectivity and benchmarks, meaning you have no way to know if your "strong operations" would survive a market comparison.
  • The Board Tribe (Consultant Audits): Costs and takes 6 to 12 weeks. This is the most complete, but it is entirely consultant-dependent and moves at a glacial pace.
The most important rule of organizational diagnostics is this: Match the blind spot you can least afford to a tool that lacks it. If you cannot afford to be wrong about your market position, a free internal framework is a liability, not an asset.

5. Takeaway 4: The Mismatch of the High-Priced Consultant

For companies in the 50M range, consultant-led organizational audits often create a "mismatch" in value. You are paying five to six figures for a diagnosis that can take three months to arrive.

In many cases, the audit ends up costing more than the fix itself. For a growing firm, the quality of these audits is entirely a function of the individual consultant’s perspective. If you are in a turnaround or a complex acquisition, the context provided by a human expert is worth the 12-week wait. But if you are simply trying to scale, you are likely wasting limited capital on context when you actually need a constraint analysis.

6. Takeaway 5: Start with the "Cheapest Measurement" to Find the Constraint

The most efficient way to assess a company is through a Structured Multi-Dimension Diagnostic. These tools use standardized instruments to measure the organization across leadership, operations, strategy clarity, financial readiness, process maturity, and AI readiness.

The logic is simple: locate the "binding constraint" first before spending real money. A structured diagnostic moves the timeline from 6 to 12 weeks down to minutes or days. It provides a comparable baseline across benchmarks that internal frameworks and sentiment surveys simply cannot touch.

"Every organizational assessment tool answers the same underlying question: what is actually true about this company, beneath what leadership believes about it?"

By starting with a multi-dimensional diagnostic, you get an honest, complete map of the organization. It tells you exactly where to dig. Allowing you to then deploy specialized (and expensive) tools like deep-dive consultants or psychometrics only where they are actually needed.

7. Conclusion: Sequence Over Selection

In the 50M range, the sequence of your assessments matters more than the tool's brand. Many leaders burn through capital by investing in deep-dive solutions for the wrong problems.

The recommended path is to lead with a structured diagnostic to identify your binding constraint. Do not guess where your bottleneck is, and do not ask your team to grade their own homework. Find the truth of the system first, then spend your money fixing it.

Which "blind spot" is your current favorite tool ignoring, and can your business afford to keep it hidden?
Watch the clip, or to read more, visit https://vwcg.app/blog/organizational-assessment-tools-compared/


Tuesday, June 23, 2026

One in Three Dentists Has Idle Chair Time and Two in Five Cannot Staff a Hygienist

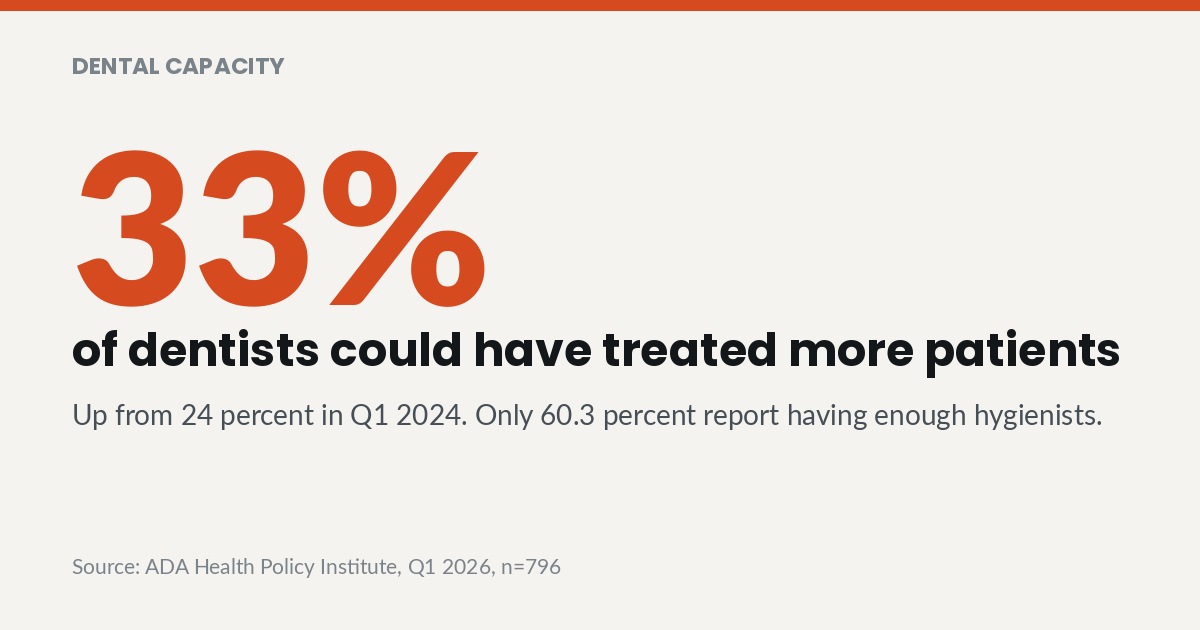
33% of dentists could have treated more patients. ADA Health Policy Institute, Q1 2026, n=796

Dental office management now has a capacity problem that looks like a demand problem. ADA Health Policy Institute data for Q1 2026 shows 33 percent of dentists report they are not busy enough, while only 60.3 percent report having enough hygienists. The empty chair and the unfilled hygiene role are usually the same problem.

Two numbers from one survey, usually read apart

The ADA Health Policy Institute publishes both findings in the same quarterly release. In Q1 2026, 33 percent of dentists said they were not busy enough and could have treated more patients, up from 24 percent in Q1 2024. The same survey, drawing on 796 responses, found 60.3 percent reported having enough hygienists.

Those two findings usually appear in separate summaries and separate conversations. Read together they describe a practice with open chair time and no clinician available to fill it. Idle capacity and an unfillable clinical role are not independent facts.

The distinction changes what a practice should spend money on. A practice reading idle chairs as weak demand buys new patient advertising. A practice reading the same signal as a labor constraint fixes the schedule and the staffing model instead.

Supporting evidence sits in the same ADA HPI release. ADA HPI found 73.5 percent of dentists reported enough dental assistants and 79.3 percent enough administrative staff in Q1 2026. The shortage concentrates in the clinical role that generates hygiene production rather than spreading evenly across the practice.

The recruiting market behind the gap

Dental practices are not passively accepting the shortage. ADA HPI reports 37.6 percent of dentists recruited a hygienist in the three months before the Q1 2026 survey. Of those recruiting, 90.5 percent rated the process very or extremely challenging.

Assistant recruiting follows a similar pattern with less intensity. ADA HPI found 36.7 percent recruited a dental assistant and 69.8 percent of those called it very or extremely challenging. Nearly every practice attempting to hire clinical staff is finding the market difficult.

The reason given is supply rather than price. ADA HPI reports 66.5 percent of dentists cited not enough applicants as the primary hygienist recruiting barrier, against 36.8 percent citing demand for high wages and benefits. A shortage of applicants does not respond to a wage increase the way a shortage of willing applicants does.

The benefit structure tells part of the story. ADA HPI found 42.6 percent of practices offer health insurance to staff in Q1 2026. A practice competing for a scarce clinician without offering health coverage is competing on wage alone against employers that do not have to.

The composition of the gap matters for hiring plans. ADA HPI puts administrative staffing at 79.3 percent adequate and assistants at 73.5 percent, against 60.3 percent for hygienists. A practice responding to the shortage by hiring at the front desk has solved a problem it did not have.

Owners frequently ask whether the shortage is temporary. Nothing in the recruiting data suggests a supply response is underway. When 66.5 percent of recruiting dentists point to applicant scarcity rather than wage demands, the pipeline itself is the constraint, and pipelines take years to refill.

Why the new patient budget is the wrong lever

Idle chair time reads as a marketing problem to most owners. The demand data does not support that reading. ADA HPI puts the new patient appointment wait time at 12.4 days in Q1 2026, down about two days from Q1 2024.

Shorter waits mean the schedule already has room in it. A practice with open availability and a marketing campaign will convert new patients into appointments the hygiene schedule cannot support. The bottleneck moves from acquisition to delivery without ever appearing in the marketing report.

The resulting failure mode is specific and costly. New patients arrive, complete an exam, and get placed on a hygiene recall the practice cannot honor within a reasonable window. Those patients leave through the back door while the front door spend continues.

Employment data confirms the sector is hiring rather than shrinking. BLS Current Employment Statistics for May 2026 put employment in offices of dentists at 1,062,300, up 1.7 percent year over year. Practices are adding people and still reporting they cannot fill the roles that matter most.

How the two constraints compound over a year

Hygiene is not only a revenue line on the schedule. It is the diagnostic channel through which most restorative treatment gets identified and planned. A practice short a hygienist loses the appointment where treatment planning normally happens.

The effect arrives with a delay, which is what makes it hard to see. Restorative production falls a quarter or two after hygiene coverage slips, by which point the owner has attributed the decline to the market. The causal chain runs backward from the schedule rather than forward from demand.

Adding new patients into that state makes the arithmetic worse rather than better. Each new patient consumes an exam slot and generates a recall obligation the practice cannot meet. The backlog grows, recall compliance falls, and the existing patient base absorbs the shortfall first.

ADA HPI data shows the idle capacity figure rising from 24 percent in Q1 2024 to 33 percent in Q1 2026. Over that same window, wait times fell and employment in offices of dentists rose. A sector adding staff while reporting more idle capacity is describing a mismatch between who gets hired and what is needed.

Wages are the visible lever and they are already moving

The wage picture explains why owners feel squeezed from both directions. The ADA HPI Survey of Dental Practice for 2025 puts the average hygienist hourly wage at $49.20, up 2.9 percent year over year, with full-time hygienists at $48.80. Average dental assistant wages reached $25.30, up 4.5 percent, with expanded-function assistants at $29.90.

That annual survey carries a 1.9 percent response rate, which is worth stating plainly. The figures work as directional benchmarks rather than as precise market rates. Practices setting compensation should read them alongside local market evidence rather than in place of it.

The monthly federal series points in the same direction. BLS Current Employment Statistics for May 2026 put average hourly earnings for production and nonsupervisory staff in offices of dentists at $34.75, up 4.1 percent year over year. Two independent sources showing wage growth in the same range is a real signal.

Real wage growth is a separate question from nominal growth. ADA HPI's State of the US Dental Economy for Q1 2026 describes dental staff wage growth as roughly zero in real terms. The trailing twelve month figure was nominal 2 percent against 2 percent inflation. Staff are not gaining ground, and owners are still paying more each year.

That combination explains why a pure wage response does not resolve the shortage. Everyone is raising wages, so relative position barely moves. Practices that win clinical hires compete on schedule, benefits and working conditions rather than on hourly rate alone.

Redesigning the staffing model instead of the marketing budget

The practical work sits in scheduling and role design. A hygiene schedule built around a single fixed appointment length wastes capacity on patients who need less and creates overruns on patients who need more. Practices that segment recall intervals by clinical risk recover chair time without hiring anyone.

Cross-training expands the assistant pool

Expanded-function assistants extend what a practice can deliver without a hygienist in every operatory. The ADA HPI Survey of Dental Practice for 2025 puts expanded-function assistant wages at $29.90 against the $49.20 hygienist average. State practice acts govern what is permitted, and the answer differs enough that no general rule applies.

Benefits are a recruiting instrument, not an expense line

With 42.6 percent of practices offering health insurance according to ADA HPI, a benefits package is a differentiator rather than a baseline. The cost is real, and the alternative is an unfilled operatory generating nothing at all. Practices that price the vacancy against the benefit cost reach a different conclusion than practices pricing the benefit alone.

Retention beats recruiting in this market

With 90.5 percent of recruiting dentists calling the hygienist search very or extremely challenging, the cheapest hire is the one already employed. Turnover in a scarce role costs weeks of lost production on top of the recruiting effort itself. Owners who cannot explain why their last clinical departure happened are managing the wrong end of the problem.

Owners who want the analysis done properly should treat it as an operations question rather than a marketing one. Chair use, provider schedules, recall compliance and staffing ratios belong on one page together. Practices needing outside help building that view often start with a management consulting engagement focused on operational capacity rather than another marketing vendor.

The jump from 24 percent to 33 percent of dentists reporting idle capacity in two years is not a demand story. Patient demand did not fall while wait times shortened and employment rose. What changed is the ability of a practice to convert existing demand into delivered care.

That reframing changes the budget conversation for the year. A dollar spent on hygiene capacity, schedule design or clinical retention returns more than a dollar spent attracting patients the practice cannot see. The constraint sits on the supply side of the operatory, and no marketing plan can reach it.

Frequently Asked Questions

How do I tell whether my open chair time is a demand problem or a staffing problem?
The test is whether the practice could deliver more care if a patient appeared tomorrow. A schedule with open operatory hours but no available hygienist is a capacity problem regardless of how it reads on a production report. ADA HPI data for Q1 2026 shows 33 percent of dentists report they are not busy enough while only 60.3 percent report enough hygienists. Practices should map open chair hours against staffed clinical hours before approving any new marketing spend.

Should my practice raise hygienist wages to fill the role?
Wage increases address the wrong barrier for most practices. ADA HPI found 66.5 percent of dentists cited not enough applicants as the primary hygienist recruiting barrier, against 36.8 percent citing demand for high wages and benefits. Raising pay in a market where every employer is raising pay changes relative position very little. Schedule flexibility, benefits and working conditions move candidates further than an hourly adjustment does.

Is it worth investing in expanded-function dental assistants?
Expanded-function assistants extend clinical delivery at a materially lower wage point. The ADA HPI Survey of Dental Practice for 2025 puts expanded-function assistant wages at $29.90 against a $49.20 average for hygienists. State practice acts determine which procedures are permitted, and the variation is wide enough that each practice must check its own rules. That survey carries a 1.9 percent response rate, so the wage figures serve as directional benchmarks rather than precise market rates.

How should my practice be measuring chair use?
Use should be measured against staffed clinical hours rather than against building hours. A practice open five days with hygiene coverage on three is running at full clinical capacity while looking idle on a facility-hours basis. Tracking scheduled hygiene hours, completed hygiene hours and open recall gaps gives a truer picture of capacity. The distance between those figures is the production a practice can recover without hiring anyone.

Does a shorter new patient wait time mean the practice needs more marketing?
Shorter waits indicate available appointment slots rather than weak underlying demand. ADA HPI reports new patient appointment wait time at 12.4 days in Q1 2026, down about two days from Q1 2024. Availability created by schedule gaps rather than by added capacity will fill and then overflow into a hygiene backlog. Practices should confirm the recall schedule can absorb new patients before spending to attract them.

What is the first operational change a short-staffed practice should make?
Recall interval segmentation returns the most capacity for the least investment. Assigning hygiene intervals by clinical risk rather than by a uniform default frees appointment time for the patients who need it. The second change is a documented retention conversation with every clinical employee, since ADA HPI found 90.5 percent of recruiting dentists rated the hygienist search very or extremely challenging. Replacing a clinician in that market costs far more than keeping one.

Wednesday, October 22, 2025

From Burnout to Profitable Growth: The Founder’s Guide to Delegating High-Stakes Ops Without Losing Control


Founders and business owners know the feeling: you are the last line of defense, solving every problem, approving every decision, and taking full responsibility for outcomes. However, this approach leads to one thing: burnout. The very strategies that made your business possible become barriers to growth as complexity and operational demands scale. Yet, for many, delegating high-stakes operations feels risky or impossible. This founder-centric guide details exactly how you can sustainably delegate critical operations, maintain control, and unlock profitable growth, using expertise and frameworks from Kamyar Shah and proven systems at World Consulting Group.

The Hidden Cost of Founder Burnout

According to 2025 research, over 68% of SMB founders report moderate to high burnout, with 54% admitting they delay operational handoffs due to fear or a lack of trust. The cost? Stalled growth, missed opportunities, and excessive errors caused by decision bottlenecks. But even more damaging, chronic burnout erodes leadership capacity, team morale, and the ability to pursue new projects.

  • Symptoms of founder burnout:
    • Constant firefighting and “urgent” tasks
    • Difficulty focusing on strategic initiatives
    • Missed deadlines and slow progress on key goals
    • Leadership fatigue and pessimism
    • High employee churn or reliance on inexperienced staff

The fastest route back to energy and profitability is strategic delegation: assigning high-stakes work to trusted leaders while keeping oversight. The key is delegating right. Not just handing off tasks, but building systems of accountability, communication, and control.

Why Founders Resist Delegation (And How to Break the Cycle)

Founders resist delegation for several reasons:

  • Fear operations will collapse or slip in quality without direct involvement
  • Belief no one understands the business as well as they do
  • Past delegation attempts that resulted in mistakes
  • Lack of time to train or onboard key team members
But the truth is, growth leaders and executive consultants have mapped out solutions for every challenge. The vast majority of successful SMBs grew by developing delegation frameworks that keep founders in control, not out of the loop.

Step One: Identify High-Stakes Operations

Not all operations can, or should, be delegated at once. Start by mapping out your “high-stakes ops,” using these benchmarks:

  • Functions with direct financial impact (e.g. sales, procurement, vendor management)
  • Critical customer experience touchpoints (e.g. onboarding, support, delivery)
  • Areas with compliance or reputational risk
  • Recurring responsibilities that take up >30% of your weekly bandwidth
Using the operations assessment tool by Kamyar Shah, founders can categorize tasks into “delegate immediately,” “delegate with oversight,” or “retain control, for now.”

Step Two: Build Clear Delegation Frameworks

Delegation fails without structure. Proven systems, like those at World Consulting Group, emphasize:

  • Documented SOPs: Write step-by-step guides for each critical task. Define expected outcomes, quality standards, and timelines.
  • Single-point ownership: Assign one accountable owner for each operation. Avoid split authority or ambiguous reporting.
  • Checklists and dashboards: Use tools for weekly monitoring. Either in digital dashboards or simple spreadsheets accessed by both the founder and the delegate.
  • Feedback cycles: Schedule regular check-ins and performance reviews to maintain effective communication and ongoing progress. Enable direct feedback, course correction, and additional training.
Download delegation templates directly from Kamyar Shah’s resource page (link) and customize for your unique ops.

Step Three: The Art of Effective Training and Empowerment

Delegating is not abdication. It is empowerment with accountability:

  • Train team members not just on technical steps, but on desired outcomes and “why” each process exists.
  • Role-play scenarios of crisis, client escalation, and exception handling.
  • Encourage questions. Document gaps for future reference and continuous improvement.
  • Use proven onboarding and coaching playbooks. Many founders partner with executive consultants for temporary fractional COO/CMO services during transition (learn more).
A founder who invests heavily in initial training will save hundreds of hours and unlock new profitability as trust deepens and operational consistency grows.

Step Four: Oversight Systems That Prevent “Losing Control”

Direct control is not needed. Visibility is. Modern oversight systems guarantee both:

  • Weekly and daily scorecards: Track KPI progress, task completion, and exceptions.
  • Automated alerts: Set up systems to notify you immediately if certain thresholds are breached (e.g. missed client delivery, over-budget spend).
  • Documentation audits: Consultants recommend regular review of completed checklists, process logs, and feedback notes (resource).
  • Quarterly business reviews: Meet with delegated owners and consultants to analyze results, correct course, and set next-stage goals.
World Consulting Group offers consulting packages with built-in control systems, so founders stay in the loop but off the “front lines” (see packages).

Step Five: Crisis Management, Handling Mistakes Without Burnout

Mistakes will happen. The difference is in response:

  • Set pre-agreed action plans for the most likely problems and exceptions.
  • Empower delegates to solve issues within clear boundaries. Reserve escalation for non-routine risks.
  • Review significant mistakes for learning, not blame. Document solutions and preventive tactics.
  • If errors repeat, refine SOPs or reassign responsibility. Consider bringing in a fractional executive for interim oversight if internal leadership needs strengthening (service details).
Consultants frequently coach teams through crisis management frameworks, improving resilience and reducing founder stress.

Step Six: Measuring Success. Profitability, Culture, and Founder Freedom

How do you know delegation is working? Track key metrics before, during, and after implementation:

Metric Pre-Delegation 6 Months After
Founder “in ops” hours/week 44 16
On-time project completion rate 53% 85%
Sales closed/quarter $90,000 $134,000
Employee retention 76% 94%
Profit margin 12% 24%

(Case data: real SMB founder clients, anonymized, supported by consulting engagements with Kamyar Shah and World Consulting Group.)

Case Study Highlight

A founder-owner of a boutique services firm was putting in 50+ “on-the-ground” hours per week, struggling to deliver client work while managing operations, onboarding, and billing. By implementing Kamyar Shah’s delegation frameworks (SOP banks, ownership matrix, feedback dashboard), and working with World Consulting Group to onboard a fractional COO for three months, the business quadrupled on-time deliveries, tripled profit margin, and retained every key staff member. Founder surveys showed burnout levels fell from “8/10” to “2/10” over the first quarter.

Frequently Asked Questions (FAQ)

  • Does delegating ops mean losing control?
    No! The best frameworks balance empowerment with oversight. Smart monitoring tools keep you informed while freeing you from daily intervention.
  • How do I train someone to “think like a founder?”
    Share context and rationale. Not just tasks. Role-play top challenges, encourage feedback, and refine delegation guides with support from a consultant (download guides).
  • Should I use a fractional executive during transition?
    Fractional leaders bring proven operational experience and coach your team. Acting as force multipliers during transition (learn more).
  • What if mistakes happen?
    Practice supportive crisis management. Use flagged errors as learning and training opportunities. World Consulting Group offers executive coaching for rapid improvement (services).
  • Is delegation really profitable?
    Absolutely. Founders free up time for growth, staff become accountable, and efficiency/completion metrics improve across the board.

Conclusion

If you are feeling burned out, stagnant, or stuck, strategic delegation is the answer. By mapping your high-stakes ops, building clear structures, empowering your team (with training and playbooks), and implementing reliable oversight, you can achieve the best of both worlds. Control and freedom. The path to profitable growth does not require sacrificing quality, losing sleep, or fearing mistakes. It can be systematic, measurable, and rewarding. Consult proven experts like Kamyar Shah and World Consulting Group for tools, guides, and leadership support that turn delegation into a growth lever.

Saturday, March 15, 2025

From Consultation to Results: A Step-by-Step Client Success Journey


Achieving client success is no longer a linear process but a dynamic journey that requires strategic planning, continuous refinement, and data-driven decision-making. The pathway from initial consultation to measurable results is critical to building long-term client relationships, driving loyalty, and ensuring sustainable growth. This report examines into the intricacies of crafting a seamless client success journey, offering actionable insights into every process stage.

The foundation of a successful client journey begins with understanding the client’s unique needs and expectations. Tools like client journey mapping help businesses visualize the stages of interaction, from initial awareness to post-purchase engagement. Organizations can tailor their strategies to enhance satisfaction and foster loyalty by identifying key touchpoints and analyzing customer feedback. For more information, explore Insight7's guide on client journey mapping.

Equally important is the role of consultation techniques in setting the stage for success. When structured effectively, strategic consultations uncover client motivations, establish clear goals, and map out actionable milestones. Techniques such as the "GROW" model and pre-session check-ins ensure that consultations are not just routine check-ins but transformative conversations. Learn more about effective consultation strategies in CoachRx's insights on strategic consultations.

Moreover, the integration of touchpoint analysis allows businesses to evaluate customer experiences at every interaction. By using methods like surveys, interviews, and data analysis, organizations can identify areas for improvement and implement changes to exceed customer expectations. This approach enhances the overall experience and builds a strong brand image. For a complete overview, refer to Customers.ai's explanation of touchpoint analysis.

Finally, measuring success through key performance indicators (KPIs) such as Net Promoter Scores (NPS), client retention rates, and customer health scores ensures that businesses remain aligned with their objectives. These metrics provide actionable insights into the effectiveness of client journey initiatives and highlight opportunities for continuous improvement. For a detailed look at customer success metrics, visit Bitrix24's article on top KPIs for 2025.

This report aims to provide a step-by-step framework for navigating the client success journey. It combines proven methodologies with innovative tools to deliver exceptional results. Businesses can transform their client relationships into lasting partnerships by focusing on consultation excellence, touchpoint optimization, and data-driven strategies.

Mapping the Client Journey: Stages and Touchpoints

Identifying Key Stages in the Client Journey

Mapping the client journey involves breaking down the entire process into distinct stages that reflect the progression of a client from initial contact to achieving their desired outcomes. These stages are critical for understanding client behaviors, expectations, and pain points. The five commonly recognized stages include:

  1. Awareness: This is when clients first learn about a business or service. They may encounter the brand through advertisements, search engine results, or word-of-mouth referrals. Companies must ensure their messaging resonates with potential clients' needs during this stage. For instance, 70% of clients rely on online reviews and recommendations before engaging with a service (Xmind Blog).
  2. Consideration: At this stage, clients actively evaluate the business's offerings against competitors. They may compare pricing, read testimonials, or explore case studies. Companies can enhance this stage by providing transparent information and addressing client concerns through FAQs or live chat support.
  3. Decision: This is the conversion point where clients commit to a service or product. Businesses must ensure a seamless and frictionless process, such as simplified checkout or contract signing mechanisms. According to SiteGround Blog, eliminating barriers during this stage can significantly boost conversion rates.
  4. Retention: Post-purchase engagement is vital for maintaining client satisfaction and loyalty. Regular follow-ups, personalized offers, and excellent customer support are key touchpoints during this stage. Studies show that retaining existing clients is five times cheaper than acquiring new ones (Insight7).
  5. Advocacy: Satisfied clients often become brand ambassadors, sharing their positive experiences through testimonials or referrals. Businesses can encourage advocacy by incentivizing referrals or demonstrating client success stories.

Categorizing and Optimizing Touchpoints

Touchpoints are the moments when clients interact with a brand, whether online or offline. Categorizing these touchpoints by journey stage allows businesses to identify opportunities for improvement.

Awareness Stage Touchpoints

  • Digital Ads and Content: Paid advertisements on platforms like Google and social media are key touchpoints. Businesses should focus on crafting compelling ad copy and visuals to capture attention.
  • SEO and Website Content: Optimized website content that answers client queries is essential. For example, 53% of website traffic comes from organic search (WebFX).

Consideration Stage Touchpoints

  • Product Demos and Webinars: Offering free trials or hosting informative webinars can significantly influence client decisions.
  • Social Proof: Promising testimonials, reviews, and case studies on the website builds trust and credibility.

Decision Stage Touchpoints

  • User-Friendly Checkout Systems: Simplified checkout processes or contract signing workflows reduce friction.
  • Personalized Assistance: Providing dedicated account managers or live chat support during this stage can help address last-minute client concerns.

Retention Stage Touchpoints

  •  Post-Purchase Communication: Sending thank-you emails or satisfaction surveys demonstrates care and interest in client feedback.
  •  Loyalty Programs: Offering discounts or exclusive benefits for repeat clients encourages continued engagement.

Advocacy Stage Touchpoints

  • Referral Programs: Incentivizing clients to refer others can amplify brand reach.
  • Social Media Engagement: Encouraging clients to share their experiences on social media platforms helps attract new clients organically.

Tools and Techniques for Effective Mapping

The right tools and techniques are essential for creating accurate and actionable client journey maps. These tools visualize the journey and provide insights into client behaviors and bottlenecks.

Visual Mapping Software

  • Lucidchart: Known for its drag-and-drop interface, Lucidchart enables teams to collaborate on journey maps in real-time (Insight7).
  • Miro: This tool offers a range of templates and integrations, making it ideal for dynamic and interactive mapping.

Behavioral Analytics Tools

  • Hotjar: Tracks website user behavior, helping businesses identify drop-off points and optimize the client journey (Marketful).
  • Glassbox: Provides deep behavioral analytics to uncover patterns and pain points in the client journey (WebFX).

Collaboration and Feedback Tools

  • Slack or Microsoft Teams: Facilitate cross-departmental collaboration to align all touchpoints.
  • SurveyMonkey: Collects client feedback at various journey stages to refine strategies.

Addressing Multi-Channel and Cyclical Journeys

Modern client journeys are rarely linear. Clients often engage with businesses across multiple channels and may revisit earlier stages before progressing. This cyclical nature necessitates a flexible and adaptive approach to journey mapping.

Multi-Channel Engagement

Clients interact with brands through various channels, including websites, social media, email, and in-person visits. Businesses must ensure consistency across all channels to provide a seamless experience. For example:

  • Omnichannel Strategies: Integrating online and offline touchpoints ensures clients receive consistent messaging and support (SiteCentre).

Cyclical Journeys

Clients may revisit earlier stages due to changing needs or new product launches. Businesses can address this by:

  • Dynamic Content: Updating website content and marketing materials to reflect evolving client needs.
  • Proactive Communication: Re-engaging clients through personalized emails or notifications about relevant updates.

Metrics and KPIs for Journey Optimization

Measuring the effectiveness of the client journey is critical for continuous improvement. Key performance indicators (KPIs) provide actionable insights into client behaviors and satisfaction levels.

Awareness Stage Metrics

  • Website Traffic: Tracks the number of visitors to the website.
  • Click-Through Rates (CTR): Measures the effectiveness of digital ads and email campaigns.

Consideration Stage Metrics

  • Engagement Rates: Tracks interactions with content such as webinars, blogs, or product demos.
  • Conversion Rates: Measures the percentage of clients who move from consideration to decision.

Decision Stage Metrics

  • Abandonment Rates: Identifies drop-offs during checkout or contract signing.
  • Time to Conversion: Measures the average time clients take to decide.

Retention Stage Metrics

  • Customer Lifetime Value (CLV): Estimates the total revenue a client will generate over their relationship with the business.
  • Net Promoter Score (NPS): Gauges client satisfaction and likelihood to recommend the brand.

Advocacy Stage Metrics

  • Referral Rates: Tracks the number of new clients acquired through referrals.
  • Social Media Mentions: Measures the frequency and sentiment of client mentions on social platforms.

By using these metrics, businesses can identify areas for improvement and ensure the client journey aligns with their expectations and needs.

Effective Consulting Techniques for Client Success

Building a Foundation of Trust and Credibility

Establishing trust and credibility is a cornerstone of effective consulting. Unlike the existing content focusing on client journey mapping or consultation processes, this section examines into specific techniques consultants can use to foster trust early in the relationship.

  • Transparent Communication: Consultants should discuss project goals, limitations, and timelines openly. This involves setting clear expectations during initial meetings and providing clients with a realistic view of deliverables. Transparency minimizes misunderstandings and builds confidence in the consultant's expertise (CompanionLink Blog).
  • Demonstrating Expertise: Sharing case studies, certifications, or relevant success stories can help establish credibility. This is particularly effective when entering new industries or working with skeptical clients.
  • Active Listening: Listening to clients’ needs and concerns helps build rapport. Techniques such as paraphrasing and summarizing ensure clients feel heard and understood, strengthening the relationship (Jotform Blog).

Customizing Solutions to Client Needs

While the existing reports discuss mapping touchpoints and stages, this section emphasizes tailoring consulting strategies to meet unique client requirements.

  • Needs Assessment: Conducting a thorough needs assessment is critical. Consultants should use structured questionnaires, interviews, and data analysis to identify pain points and opportunities. This ensures that proposed solutions are relevant and actionable (Qualified Finder).
  • Personalized Recommendations: Generic solutions often fail to address specific challenges. Consultants can deliver higher value by tailoring recommendations to the client's industry, size, and goals. For instance, a small business may require cost-effective strategies, while a large corporation might prioritize scalability.
  • Iterative Feedback Loops: Engaging clients in an iterative feedback and refinement process ensures solutions remain aligned with their evolving needs. This technique fosters collaboration and increases the likelihood of successful implementation.

Using Technology for Enhanced Client Engagement

This section explores how technology can improve client interactions and outcomes, a topic not covered in the existing reports.

  • Digital Collaboration Tools: Platforms like Slack, Trello, and Microsoft Teams facilitate real-time communication and project tracking. These tools help consultants and clients stay aligned on objectives and progress (AtlasCRM).
  • Data Analytics: Using analytics tools enables consultants to provide data-driven insights. For example, customer behavior analytics can help identify trends and inform strategic decisions.
  • Virtual Meeting Platforms: Tools like Zoom and Microsoft Teams have become essential for remote consultations. Features such as screen sharing and recording enhance the quality of interactions and ensure key points are documented.
  • Automation: Automating routine tasks like scheduling, invoicing, and reporting frees up time for consultants to focus on strategic activities. Tools like Calendly and QuickBooks are particularly useful in this regard.

Enhancing Client Retention Through Proactive Support

This section focuses on strategies to retain clients post-consultation, distinguishing itself from existing content on touchpoints and metrics.

  • Regular Check-Ins: Scheduling periodic follow-ups helps consultants stay updated on client progress and address any emerging challenges. This demonstrates a commitment to long-term success.
  • Value-Added Services: Additional services, such as training sessions or access to exclusive resources, can enhance client satisfaction and loyalty. For example, consultants could provide workshops on implementing recommended strategies.
  • Measuring Impact: Providing clients with measurable results, such as increased revenue or improved efficiency, reinforces the value of the consultant's work. Tools like Google Analytics or Tableau can be used to track and present these metrics (Thinkific).
  • Client Feedback Mechanisms: Implementing feedback systems, such as surveys or one-on-one interviews, helps consultants identify areas for improvement and adapt their approach.

Developing Emotional Intelligence for Client Success

This section introduces the role of emotional intelligence (EI) in consulting, a topic not previously addressed in the existing reports.

  • Empathy: Understanding and addressing clients' emotional needs fosters stronger relationships. For instance, acknowledging the stress a client may feel during organizational changes can help build trust.
  • Conflict Resolution: Consultants often navigate conflicts between stakeholders. Using EI skills like active listening and impartial mediation can help resolve disputes effectively.
  • Adaptability: Emotional intelligence enables consultants to adapt their communication style to suit different personalities and situations. For example, a data-driven client may prefer detailed reports, while another might value concise summaries.
  • Building Resilience: Consultants face high-pressure situations, such as tight deadlines or demanding clients. Developing emotional resilience helps maintain professionalism and focus under stress.

By integrating these techniques, consultants can enhance their effectiveness and deliver superior client outcomes. Each section complements but does not overlap with the existing reports, ensuring a unique and valuable contribution to the larger report.

Measuring and Refining Client Success Metrics

Establishing Actionable Metrics for Client Success

Actionable metrics are critical for evaluating the effectiveness of client success initiatives. Unlike vanity metrics like website traffic, actionable metrics provide tangible insights into client behavior and satisfaction. For example, tracking metrics like client retention rates and Net Promoter Scores (NPS) can help businesses assess loyalty and advocacy levels (SGBS Consulting).

Additionally, revenue growth is a key indicator of the financial impact of client success strategies. Businesses can identify the long-term value of their customer relationships by analyzing revenue generated from repeat clients. This differs from existing content on retention stage metrics by focusing on actionable financial outcomes rather than predictive estimations like Customer Lifetime Value (CLV).

Integrating Quantitative and Qualitative Data

While quantitative metrics such as NPS and Customer Effort Score (CES) are widely used, qualitative data offers deeper insights into client needs and satisfaction. For instance, client interviews and open-ended survey questions can uncover specific pain points not evident in numerical data (EvaluationsHub).

Businesses can adopt a multi-metric approach by blending these data types. For example, combining NPS scores with qualitative feedback allows a more complete understanding of client health. This approach moves beyond traditional metrics discussed in existing content to emphasize integrating diverse data sources for a complete view.

Using Advanced Analytics for Real-Time Insights

Real-time analytics tools enable businesses to monitor client success metrics continuously. Platforms like Gainsight and Totango provide real-time dashboards that track metrics such as client engagement and health scores (EvaluationsHub). These tools allow businesses to identify issues and take immediate corrective action.

Unlike existing discussions on metrics and KPIs for journey optimization, this section focuses on the technological advancements that facilitate real-time monitoring and intervention. For example, AI-driven analytics can predict client churn by analyzing behavioral patterns, enabling proactive measures to retain clients.

Refining Metrics Through Continuous Feedback Loops

Continuous improvement is essential for refining client success metrics. Regularly updating metrics based on client feedback ensures they remain relevant and aligned with business goals. For instance, businesses can use feedback loops to adjust their metrics as client needs evolve (Growett).

This section differs from existing content on feedback mechanisms by emphasizing the iterative process of refining metrics rather than simply collecting feedback. For example, if clients indicate dissatisfaction with response times, businesses can introduce a new metric to track and improve this aspect of their service.

Aligning Metrics with Business Objectives

Aligning client success metrics with broader business objectives ensures that efforts are focused on achieving meaningful outcomes. For instance, metrics such as ROI and cost savings directly tie client success initiatives to financial performance (The Cambridge Consultant).

This section builds on existing content by exploring the strategic alignment of metrics with business goals. For example, while previous reports discuss measuring impact, this section examines into how metrics like ROI can demonstrate the tangible value of client success initiatives to stakeholders.

Using Predictive Analytics for Future Planning

Predictive analytics tools enable businesses to forecast client behavior and outcomes based on historical data. For example, machine learning algorithms can predict client churn rates or identify opportunities for upselling (EvaluationsHub).

This section introduces the concept of predictive analytics, which is not covered in existing content. By using these tools, businesses can proactively address potential issues and capitalize on growth opportunities, ensuring long-term success.

Enhancing Collaboration Through Shared Metrics

Establishing shared metrics across teams fosters collaboration and accountability. Aligning metrics between sales and customer success teams can improve upsell and cross-sell opportunities (EvaluationsHub).

This section expands on the idea of shared goals by focusing on the operational benefits of cross-functional metrics. For example, tracking joint metrics such as client acquisition cost (CAC) and client lifetime value (CLV) ensures that all teams work towards common objectives.

Adopting a Minimum Viable Product (MVP) Approach

Starting with a Minimum Viable Product (MVP) version of a client success dashboard allows businesses to initially focus on the most critical metrics. For example, tracking just 3-5 key metrics can provide valuable insights without overwhelming teams (Melisa Liberman).

This section differs from existing content by emphasizing the importance of simplicity in metric selection. Businesses can gradually expand their metrics by starting small as their capabilities and needs evolve.

Incorporating Outcome-Based Metrics

Outcome-based metrics focus on the tangible results achieved through client success initiatives. Tracking metrics like revenue generation and cost savings demonstrates the direct impact of these efforts on the client's bottom line (Potis AI).

This section complements existing discussions on measuring success by introducing the concept of outcome-based metrics. Unlike traditional metrics that focus on process efficiency, outcome-based metrics highlight the end results of client success strategies.

Building Trust Through Transparent Metrics

Transparent communication about metrics fosters trust between businesses and their clients. For example, sharing regular updates on metrics like project success rates and client satisfaction scores demonstrates a commitment to accountability (The Cambridge Consultant).

This section builds on existing content by emphasizing the role of transparency in building trust. By openly sharing metrics, businesses can strengthen client relationships and position themselves as trusted partners.

Focusing on these areas can help businesses effectively measure and refine their client success metrics, ensuring continuous improvement and alignment with strategic objectives.

Conclusion

The research highlights the importance of mapping the client journey as a structured, multi-stage process to enhance client success and satisfaction. Businesses can better understand client behaviors, expectations, and pain points by breaking the journey into five key stages, Awareness, Consideration, Decision, Retention, and Advocacy. Each stage is supported by specific touchpoints, such as digital ads, product demos, user-friendly checkout systems, post-purchase communication, and referral programs, which can be optimized to improve client experiences. Additionally, using tools like Lucidchart for journey visualization and Hotjar for behavioral analytics ensures a data-driven approach to refining the client journey.

The report also highlights the value of effective consulting techniques, including transparent communication, personalized solutions, and technology to enhance client engagement. Emotional intelligence, proactive support, and iterative feedback loops strengthen client relationships and ensure long-term success. Moreover, integrating actionable metrics, such as Net Promoter Scores (NPS), client retention rates, and revenue growth, allows businesses to measure and refine their strategies. Adopting advanced analytics tools like Gainsight and predictive analytics enables real-time insights and future planning, ensuring businesses remain agile in addressing client needs.

The findings emphasize that a client-centric approach, supported by technology, data, and collaboration, is essential for achieving superior outcomes. Businesses should prioritize aligning client success metrics with broader objectives, fostering cross-functional collaboration, and maintaining transparency to build trust. As the following steps, organizations should focus on implementing dynamic, omnichannel strategies to address the cyclical nature of modern client journeys and continuously refine their processes through feedback and advanced analytics. This approach will enhance client satisfaction and drive long-term loyalty and advocacy, positioning businesses for sustained growth.

References